

The NYT published an article today on “Which start-up could be the next big thing?” Of course, who really knows. The NYT basically appears to be looking at “buzz.” But what we would really want is some forecast of potential demand.
This is where Google trends becomes useful. For instance, the NYT considers SnapChat and Whatsapp as two potential contenders. Both are in the same kind of market. Let’s see what they look like on Google trends.
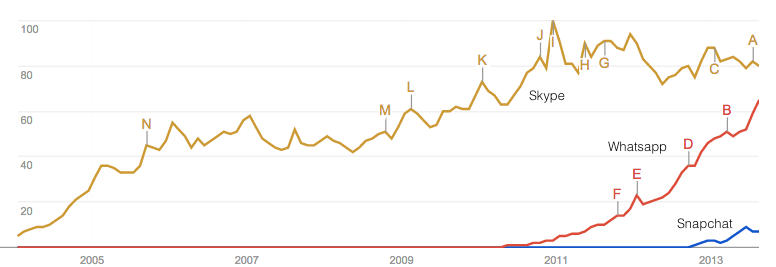
It is clear here that Whatsapp is much more significant than Snapchat in terms of searchers people are making.
Let’s look now at Myo and Oculus VR where I use Thalmic instead of Myo because apparently that brings up other things:
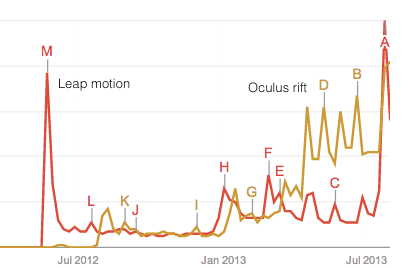
Here Thalmic are too early to get onto the searches although if you zoom in on them, they had an initial bump with Y-combinator and have been steady since. By contrast, Leap has been hit by news events whereas Oculus rift seems to have steadier growth.
Now consider Lyft. It seems to me that the right comparator is Uber.
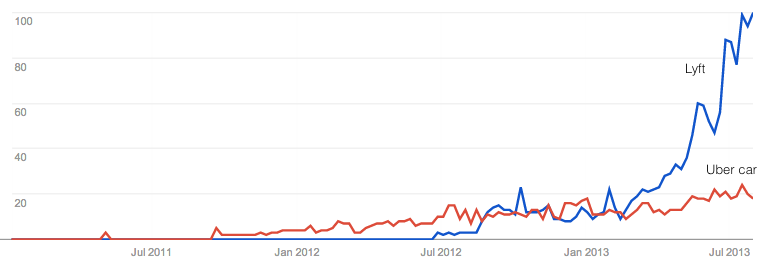
Here we can see the Lyft is, on a fast trajectory but it is hard to compare as “Uber” isn’t a great search term so I used “Uber car” instead.
Finally, here is the data for Wanelo — something I hadn’t heard of before.
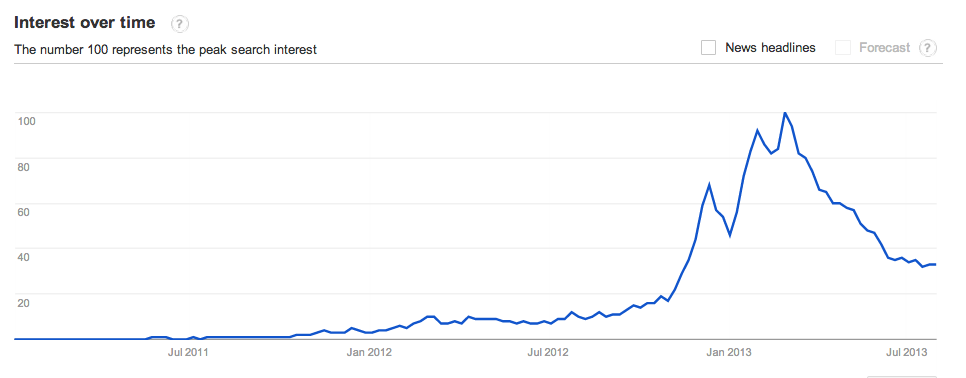
Hmm, it seems like that there was initial interest but it has waned. This is not a pretty picture for the next big thing.
Anyhow, as a final graph to whet your appetite take a look at this:
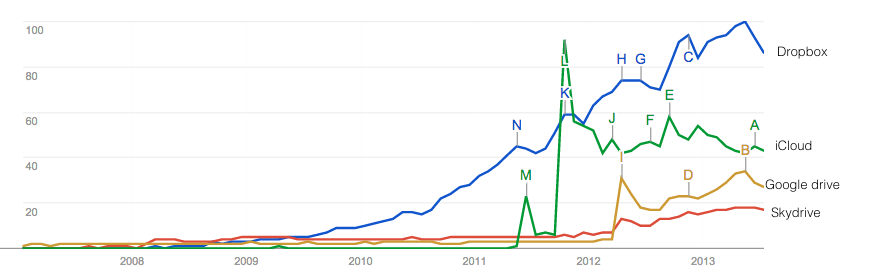
That one seems quite telling.

Keep track of these analytics over time for two up-and-coming startups, then compare the expected (google trends) with the actuals. Then repeat over and over again. See if there is a correlation, and if so, how strong. Then build a web app. Would make for some awesome content marketing!
I’m not sure “predicting” is the right verb here. Perhaps “observing”. Our maybe “confirming”. The real question is whether you could improve your returns by investing as an angel or VC based on this type of analysis. Even if this data were a leading indicator, it might already be priced into the valuation (either directly or indirectly via correlation with other metrics investors use). Now that would be a nifty analysis if someone could do it.